
Market Summary
Global Rare Earth Recycling Market Overview
The global rare earth recycling market is projected to register a CAGR of around 5.79% to reach USD 735.65 million by the end of 2030.
Rare earth metals, including the lanthanide series, scandium, and yttrium, are critical components in permanent magnets, electric vehicles, smartphones, and wind turbines, among others. The elements occur naturally as mixtures in ores and must be purified prior to use. However, the mining and separation of the mineral ore is challenging, in addition to being energy- and waste-intensive. These elements currently have a significant environmental burden. Despite their capability for reuse, the vast majority are discarded into the trash after only one use.
Recycling rare-earth-containing products offer a steady, domestic source of rare earth materials to manufacturers while also reducing waste. The addition of recycled materials is expected to reduce environmental contamination and energy costs associated with their primary mining and separations.
The global rare earth recycling market is expected to witness strong growth during the review period because of the high demand for rare earth metals in smartphones, electric vehicles, wind turbines, laptops, and others. The key driver of the recycling market is the environmental and cost concerns associated with the mining of rare-earth metals. Moreover, the pricing of rare earth metals is highly sensitive as China dominates the production and controls the prices of these materials. The adoption of e-waste recycling across the globe is expected to boost the recycling of rare earth materials. However, pollution, high costs, and inefficiency related to recycling hinder market growth.
Rare-earth metals are extracted through mining, which comes with many downsides such as high cost and inefficiency because extracting even a minimal amount of rare earth metals requires large areas to be mined. Moreover, the extraction process has an enormous environmental impact and generates large volumes of toxic and radioactive material. This is due to the co-extraction of thorium and uranium, which are radioactive metals. Mines also contain pools of wastewater that can potentially pour into local waterways.
Moreover, the dominance of China in the total rare earth metals production makes it legally difficult for other countries to extract the materials, which also has spiked prices to a certain extent. China has such a monopoly on the sector that rare earth elements prices spiked in 2010 and 2011 when exports were cut. That sparked a boom for rare earth companies and mining projects worldwide, as they sought to create a reliable supply of rare earth outside of China. Many rare earth mining projects outside of China failed to thrive when rare earth elements prices fell again. High production, low labor costs, and relaxed environmental regulations have allowed China to control rare earth metals' pricing and market viability. However, in 2014, the World Trade Organization determined that China’s export practices, including duties and quotas, breached certain regulations.
Covid Impact Analysis
The first half of 2020 proved to be an unexpected turning point for various industries globally, including chemical industry. The emergence of COVID-19 has exacerbated the situation by depressing the automotive and electronic sectors (among other sectors) and disrupting existing supply chains. The global pandemic has had a severe impact on the rare earth recycling market. The recycling of rare earth metals has declined amidst the COVID-19 pandemic as the market players had to shut production facilities or operate the facilities below the optimal production capacities to avoid the spread of the coronavirus. Additionally, decline in e-waste collection led to the limited availability of raw materials owing to supply disruptions has resulted in a decline in production.
The preventive and protective measures taken by the government, public health officers, and producers in response to COVID-19 have had and will continue to have a negative impact on businesses, suppliers, distribution channels, and end-users, including indefinite business shutdowns or disruptions, reduced operations, reduced ability to supply products, or reduced demand for products. However, manufacturers have showcased various developments during the pandemic despite of all the odds related to acquisition, expansion, and product launch to sustain in the worsening situations. As these disruptions emerge at unprecedented rates and magnitudes, businesses are having to adapt and respond in an ever-changing global environment to de-risk supply chains, safely maintain operations, continue production, and ensure the availability of their products.
The global rare earth recycling market is facing a deep recession in 2020 caused by the effects of lockdowns in most of the geographies to slow down the spread of COVID-19. However, manufacturers have come up with the new strategy to tackle the challenges faced during the initial outbreak of COVID-19. Furthermore, the demand for rare earth recycling has virtually dampened for the period and are unlikely to be revived in the coming period. The major consumers of rare earth recycling such as automotive, aerospace, machining tools, and wind energy have also shut down their production facilities resulting in a decline in demand for rare earth recycling globally. However, with the lift of lockdown measures and trade restrictions, the demand for rare earth recycling is expected to gain pace and drive market growth.
Supply Chain Analysis
The value chain analysis enables the reader to comprehend the steps and stakeholders involved in the process of manufacturing and distribution of rare earth recycling. The value chain includes raw material suppliers, rare earth recycling manufacturers, distribution channel, and application.
Rare earth elements can be found in a variety of products, including battery alloys, polishing powders, liquid crystal displays (LCDs), hybrid cars, and light emitting diodes (LEDs). Only a few industrial recycling activities are currently implemented for rare earths. Until now, there has been no large-scale recycling of rare earths from magnets, batteries, lighting and catalysts. The main post-consumer activities include the recycling of rare earths from electric motors and hard disks and other electronic components. Pre-consumer and post-consumer recycling research is being carried out on various end-of-life products including magnets, automotive batteries, lamps and fluorescent lamps, and spent catalysts (industrial as well as automotive catalysts), amongst others.
Segmentation
The global rare earth recycling market has been segmented on the basis of type, application, and region.
By type, the rare earth recycling market has been segmented into light rare earth recycling and heavy & medium rare earth recycling. The light rare earth recycling segment accounted for the largest market share in 2020 due to wide utility in super magnets, catalytic converters, UV protective glasses, carbon arc lights, CAT scan scintillators, batteries for hybrid vehicles, computers, electronic devices, and to polish glass surfaces.
Based on the applications, the global rare earth recycling market is segmented into permanent magnets, catalyst, glass, ceramics, phosphor, alloy manufacturing, and others. Permanent magnets were the leading application segment and accounted for the highest share of the overall market revenue in 2020.
Global Rare Earth Recycling Market Revenue, by Application, 2020 (USD Million)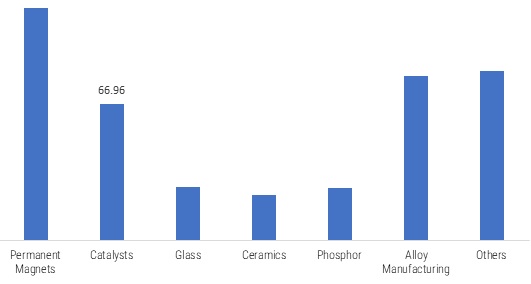 Sources: MRFR Analysis
Permanent magnets are made up of an alloy of neodymium, boron, and iron which are widely used in mobile phones, speakers, wind turbines generators, hybrid electric vehicles, hard drives, television, and transducers. There is an upsurge in demand for rare earth elements due to their geochemical properties in the automotive industry for hybrid electric vehicles. This is likely to drive the demand for rare earth recycling elements during the forecast period.
Global Rare Earth Recycling Market Share, by Region, 2020 (%)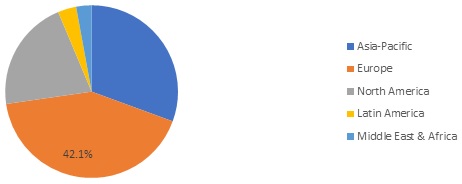 Sources: MRFR Analysis
Regional Analysis
The global rare earth recycling market has been studied across Asia-Pacific, North America, Europe, Latin America, and Middle East & Africa. Asia-Pacific accounted for more than 30% of the global market share in 2020. The key players operating in the Asia-Pacific market are adopting various business strategies such as R&D, joint ventures, new product launches, portfolio expansions, contratcs & agreements, and acquisitions to strengthen their market hold.
The market growth in Europe can be attributed to growing penetration of industry participants in countries such as Germany and UK. Constant product development through high-level research & development activities across these countries are anticipated to pave way for moderanizations in the field of rare earth recycling market over the coming years.
The US has one of the largest markets for permanent magnets across North America. Robust use of permanent magnets in various electronic products such as television, cellular phones, speakers and more across the country is anticipated to reflect steady growth in demand for rare earth recycling market across North America.
Key Players
Key players operating in the global rare earth recycling market include Solvay (Belgium), Hitachi Metals (Japan), REEcycle, Inc. (US), Jiangsu Huahong Technology Co., Ltd (China), Lynas (Malaysia), GanZhou QianDong Rare Earths Group Co., Ltd (China), Mitsubishi Chemical Corporation (Japan), Nissan Motor Co Ltd (Japan), Geomega Resources (Canada), and Shenghe Resources Holdings Co., Ltd (China) among others.
Jiangsu Huahong Technology Co., Ltd., Solvay SA, Hitachi Metals and Mitsubishi Chemical Corporation are the prominent players operating in the global rare earth recycling market. These players account for a major share of the global market owing to their industry experience, wide product portfolio, global revenue base, and distribution network worldwide.
The players followed key strategic initiatives such as product launch, partnership, and expansion in the global mobile emission catalysts market. For instance, in February 2021, Lynas Rare Earths Ltd had signed an agreement with the US Government to develop a Light Rare Earth separation facility in the US to enhance their market position in the country.
Market Segmentation
Global Rare Earth Recycling Market, by Type
- Light Rare Earth Recycling
- Medium & Heavy Rare Earth Recycling
Global Rare Earth Recycling Market, by Application
- Permanent Magnets
- Catalysts
- Glass
- Ceramics
- Phosphor
- Alloy Manufacturing
- Others
Global Rare Earth Recycling Market, by Region
- North America
- US
- Canada
- Europe
- Germany
- UK
- Russia
- France
- Italy
- Nordic Countries
- Rest of Europe
- Asia-Pacific
- China
- Japan
- India
- South Korea
- Southeast Asia
- Australia & New Zealand
- Rest of Asia-Pacific
- Latin America
- Mexico
- Brazil
- Argentina
- Rest of Latin America
- Middle East & Africa
- Turkey
- South Africa
- Saudi Arabia
- UAE
- Rest of Middle East & Africa
Available Additional Customizations
- Customer Analysis of Major Consumers
- Additional Company Profiles
Intended Audience
- Rare earth recycling manufacturers
- Suppliers and traders of rare earth recycling and related products
- Government, associations, and industrial associations
- Investors and trade experts
- Consulting in chemical experts
Market Size & Forecast
{}

Leave a Comment